A product backlog item, a user story, or any other piece of work is measured in story points, which are a unit of measure for conveying an estimate of the entire effort (or complexity) required to implement it.
We assign a point value to each item when estimating with story points. Teams usually utilize a Fibonacci or Fibonacci-like scale of 1,2,3,5,8,13,21, and so on. These points are frequently rolled up as a technique of monitoring velocity (the sum of points for items finished that iteration) and/or capacity planning (the number of points we can fit in an iteration).
Story points appear to be a good idea for a variety of reasons:
- The relative method eliminates the need for a ‘date commitment’, so no artificial deadlines.
- It is less expensive than traditional estimation.
- Collaboration and cross-functional behaviors are encouraged.
- You cannot compare teams using different story point definitions.
But there are a few things you may not know about story points:
- Story points were not (and have never been) referenced in the Scrum Guide, nor have they been a required component of Scrum.
- The eXtreme Programming (XP) initiative gave birth to story points.
- They began by estimating in “ideal days” and later, unitless Story Points. – Ron Jeffries is credited with introducing them.
Ron Jeffries, the creator of story points estimation, has a word of caution to anyone using the story points to estimate their work – “beware of using story points, they turn out to have been a bloody mistake.”
Problems with story points:
- They can confuse customers.
- Within a team, they are wildly inconsistent.
- They may promote negative behaviors.
- They are a clumsy planning technique that’s full of assumptions
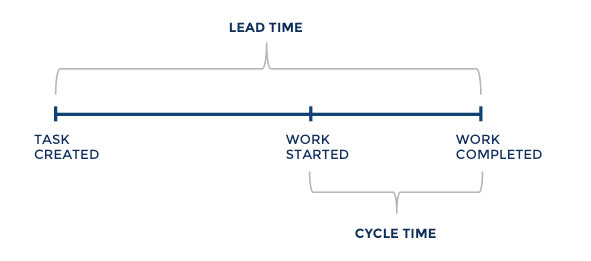
To address some of the above problems, Nick Brown, in his article “Story Pointless,” is proposing some better ways for story estimation/forecasting. He suggests that two key flow metrics be used – Cycle Time and Work Item Age.
The length of time that has passed between when a work item began and when it was completed is known as Cycle Time. Our 85th percentile indicates that we complete 85 percent of our stories in N days or fewer. As a result, we can explain this to consumers and stakeholders by saying, “If we start working on this now, we have an 85% chance of finishing it in N days or fewer.”
If the customer is satisfied with the prediction and we begin work on an item, it is critical that we do not stop there and continue to manage the customer’s expectations.
Work Item Age is the second metric for use to keep a constant focus on flow. This is the time difference (in days) between the start and the present time. This only applies to products that are still being worked on.
We should use this in the Daily Scrum to compare an item’s age to our 85th percentile time, as well as to see where it is in our process.
If the cycle period is about to be ‘breached,’ we need to swarm on an item or break it down as needed. If this isn’t possible, there’s a need to consult with stakeholders to come up with the best solution.
Our duty as a Scrum Master / Agile Delivery Manager / Coach would be to help the team comprehend the trade-offs between high WIP age items vs. those closest to completion vs. starting something new.
In the world of software development, estimating when something will be completed is particularly difficult. Our work is primarily in the ‘Complex’ (using Cynefin) domain, where there are “unknown unknowns.” When someone inquires, “When will it be finished?” — because there are so many variables to consider, we can’t give them a single date or number. As a result, rather than approaching the question as deterministic (a single possibility), we approach it as probabilistic (a range of possibilities), so we give the answer with a probabilistic date range instead of a specific date. We also don’t use story points.